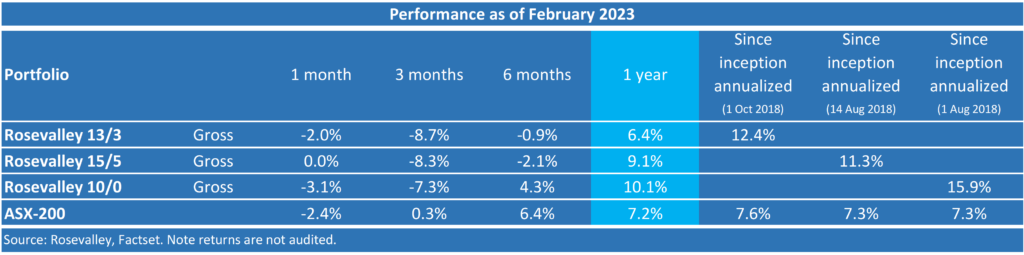
The three different Rosevalley funds started trading at various dates during August-October 2018. Performance since inception has been very strong, placing the funds near the top of the commercially available large-cap funds in Australia. Note that the numbers below are unaudited. More information available on request.
Most recent performance matrix (before trading costs):
Performing relative to the benchmark over the past 12 months ranges from -1% to +3%.
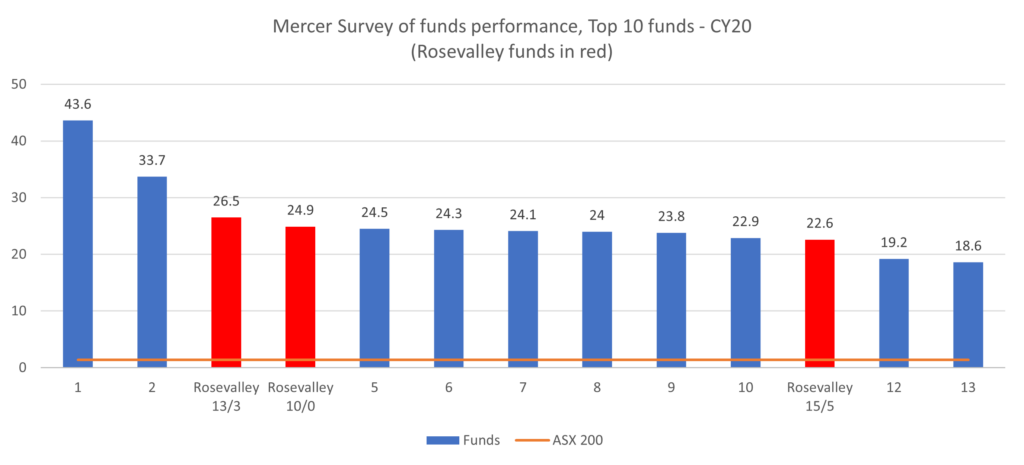
Performance for CY20 (year to 31 December 2020)
As usual, Mercer tabulated and ranked fund managers’ performance for CY20. We have only been able to see the top-10 funds in the survey. Had the Rosevalley funds been part of the survey, Rosevalley 13/3 and 10/0 and 15/5 would have taken 3rd, 4th, and 11th place respectively (based on net performance with an estimated correction for the loss of performance due to the small size of 15/5 and 10/0 portfolios).
Rosevalley 13/3 now ranked in the top-10 in the surveys for June 2019, December 2019, June 2020 and December 2020 – one of only 2 funds in the survey to do so.
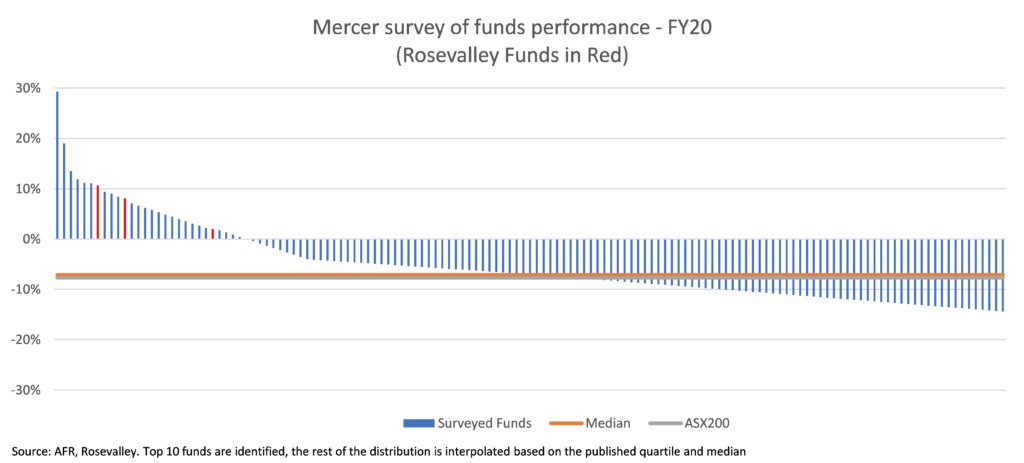
Performance for FY20 (year to 30 June 2020)
As usual, Mercer tabulated and ranked fund managers’ performance for FY20. We don’t have access to the full list, but from various newspaper reports we have the top 10, the median, and the top and bottom quartile, and we can construct the chart below. The closest peer group is Australian large cap funds. In this group, the best performer returned 29.3%, and the second best 19.0%. Had the Rosevalley funds been part of the survey, Rosevalley 13/3 and 15/5 and 10/0 would have taken 7th, 11th and 24th place respectively (based on net performance with an estimated correction for the loss of performance due to the small size of 15/5 and 10/0 portfolios).
Rosevalley 13/3 now ranked in the top-10 in the surveys for June 2019, December 2019, and June 2020 – one of only 2 funds in the survey to do so.
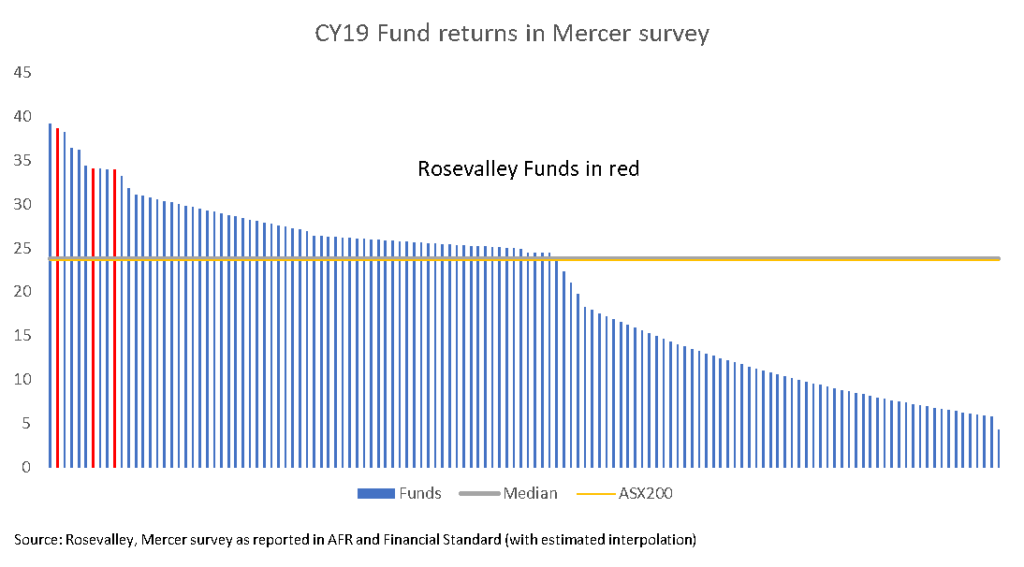
Performance for CY19 (year to 31 December 2019)
As usual, Mercer tabulated and ranked fund managers’ performance for CY19. We don’t have access to the full list, but from various newspaper reports we have the top 10, the median, and the bottom, and we can construct the chart below. The closest peer group is Australian large cap funds. In this group, the best performer returned 39.2%, and the second best 38.2%. Had the Rosevalley funds been part of the survey, Rosevalley 13/3 would have taken 2nd place. As traded, Rosevalley 15/5 would have been in the top quartile. If we make an estimated adjustment for the outsized trading costs related to the small size of the portfolio, the portfolio would have been in 10th place. Similarly, as traded Rosevalley 10/0 came in around the median, but corrected for size would have been nr. 7.
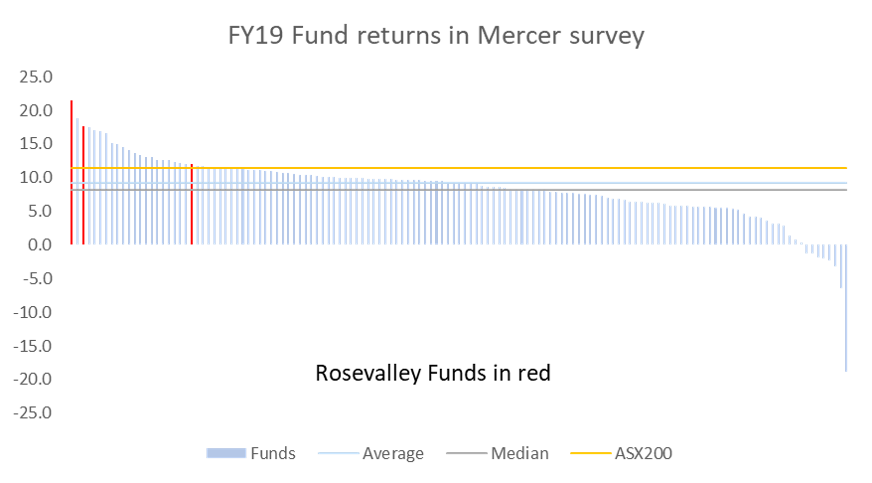
Performance for FY19 (year to 30 June 2019)
If the funds had operated for the full year to June 2019, they would have been among the top-performing funds in the Australian market, as per the Mercer survey